Notebooks your AI can write. Pipelines it can run.
Point Claude, Cursor, or any MCP agent at Loom and get back a runnable, explained notebook — the SQL, the Python/TypeScript, the charts, the prose — backed by a real workflow run. Workflow DAGs, serverless functions, streaming ingestion, and embedded SQL in one process. Tasks run in ~1 ms on warm workers.
$ docker run -p 7420:7420 -e LOOM_PASSWORD=change-me ghcr.io/danielmcsheehy/rust-orchestratorSix teaching labs. Zero clicks in the UI.
Live demo: every lab below is published read-only on a real Loom instance — open one and scroll. Outputs are the saved results of the run; nothing can be executed or edited without signing in.
Each notebook below was produced end to end by an AI agent talking to Loom's MCP server: it wrote a Python + TypeScript DAG, ran it, ingested the results, queried them with SQL, and wrote the explanation and charts. The numbers are from the real runs.
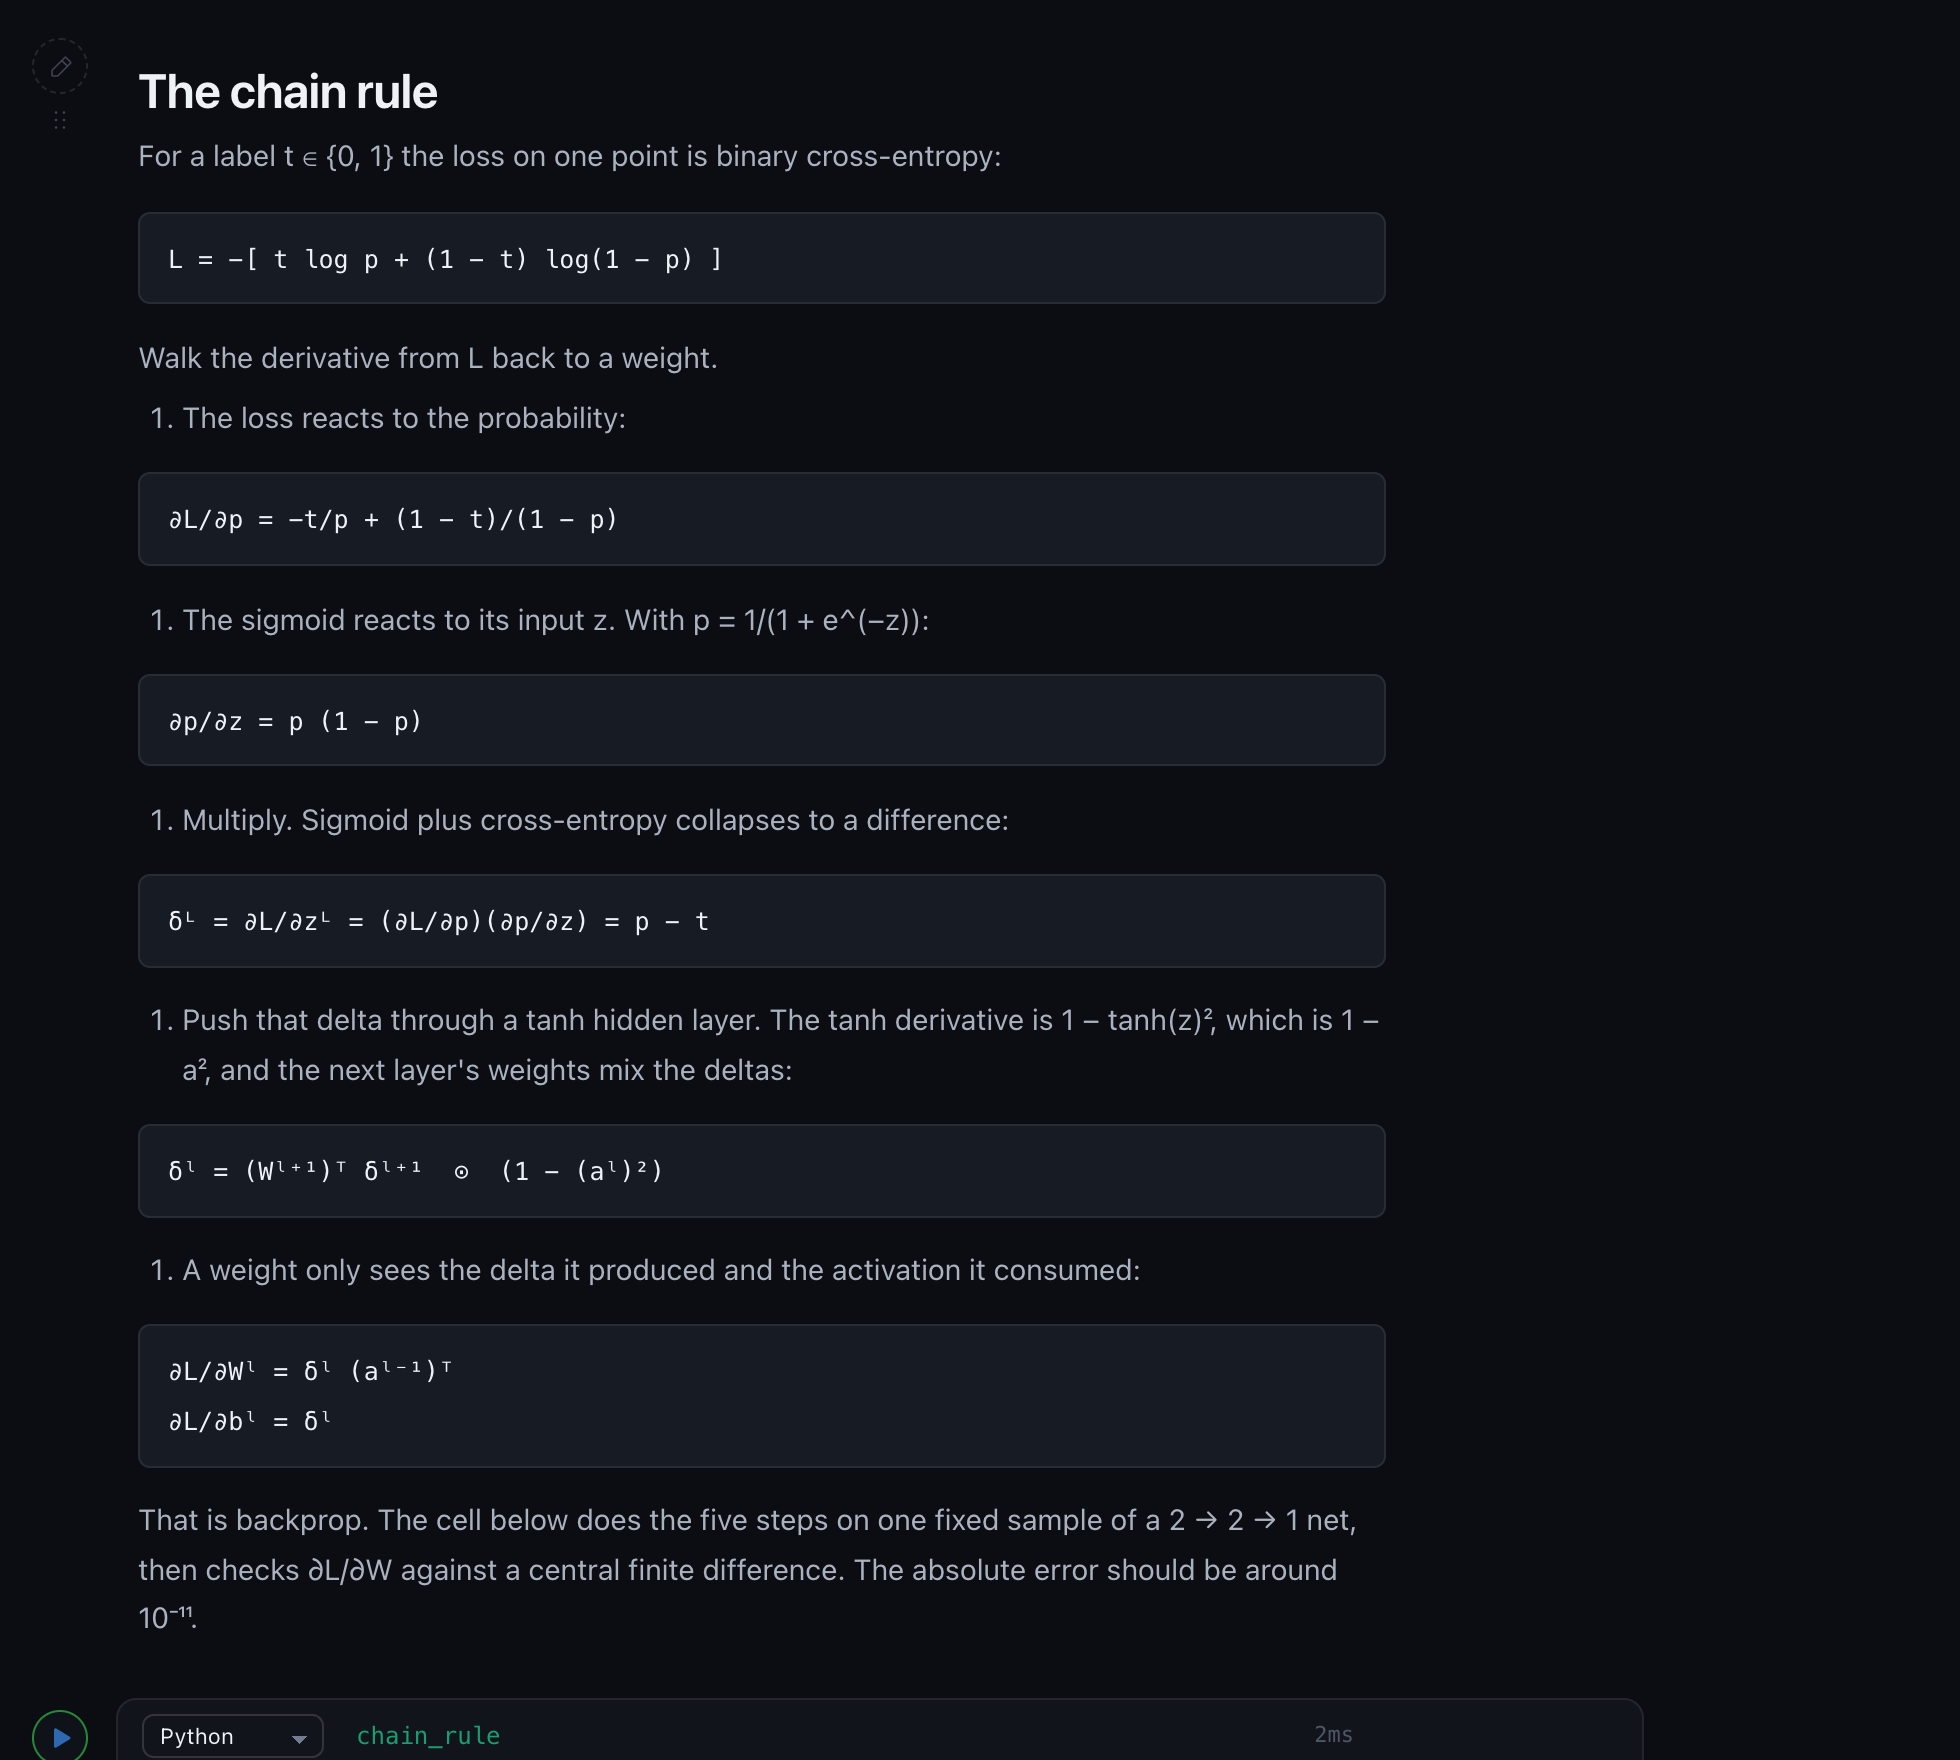
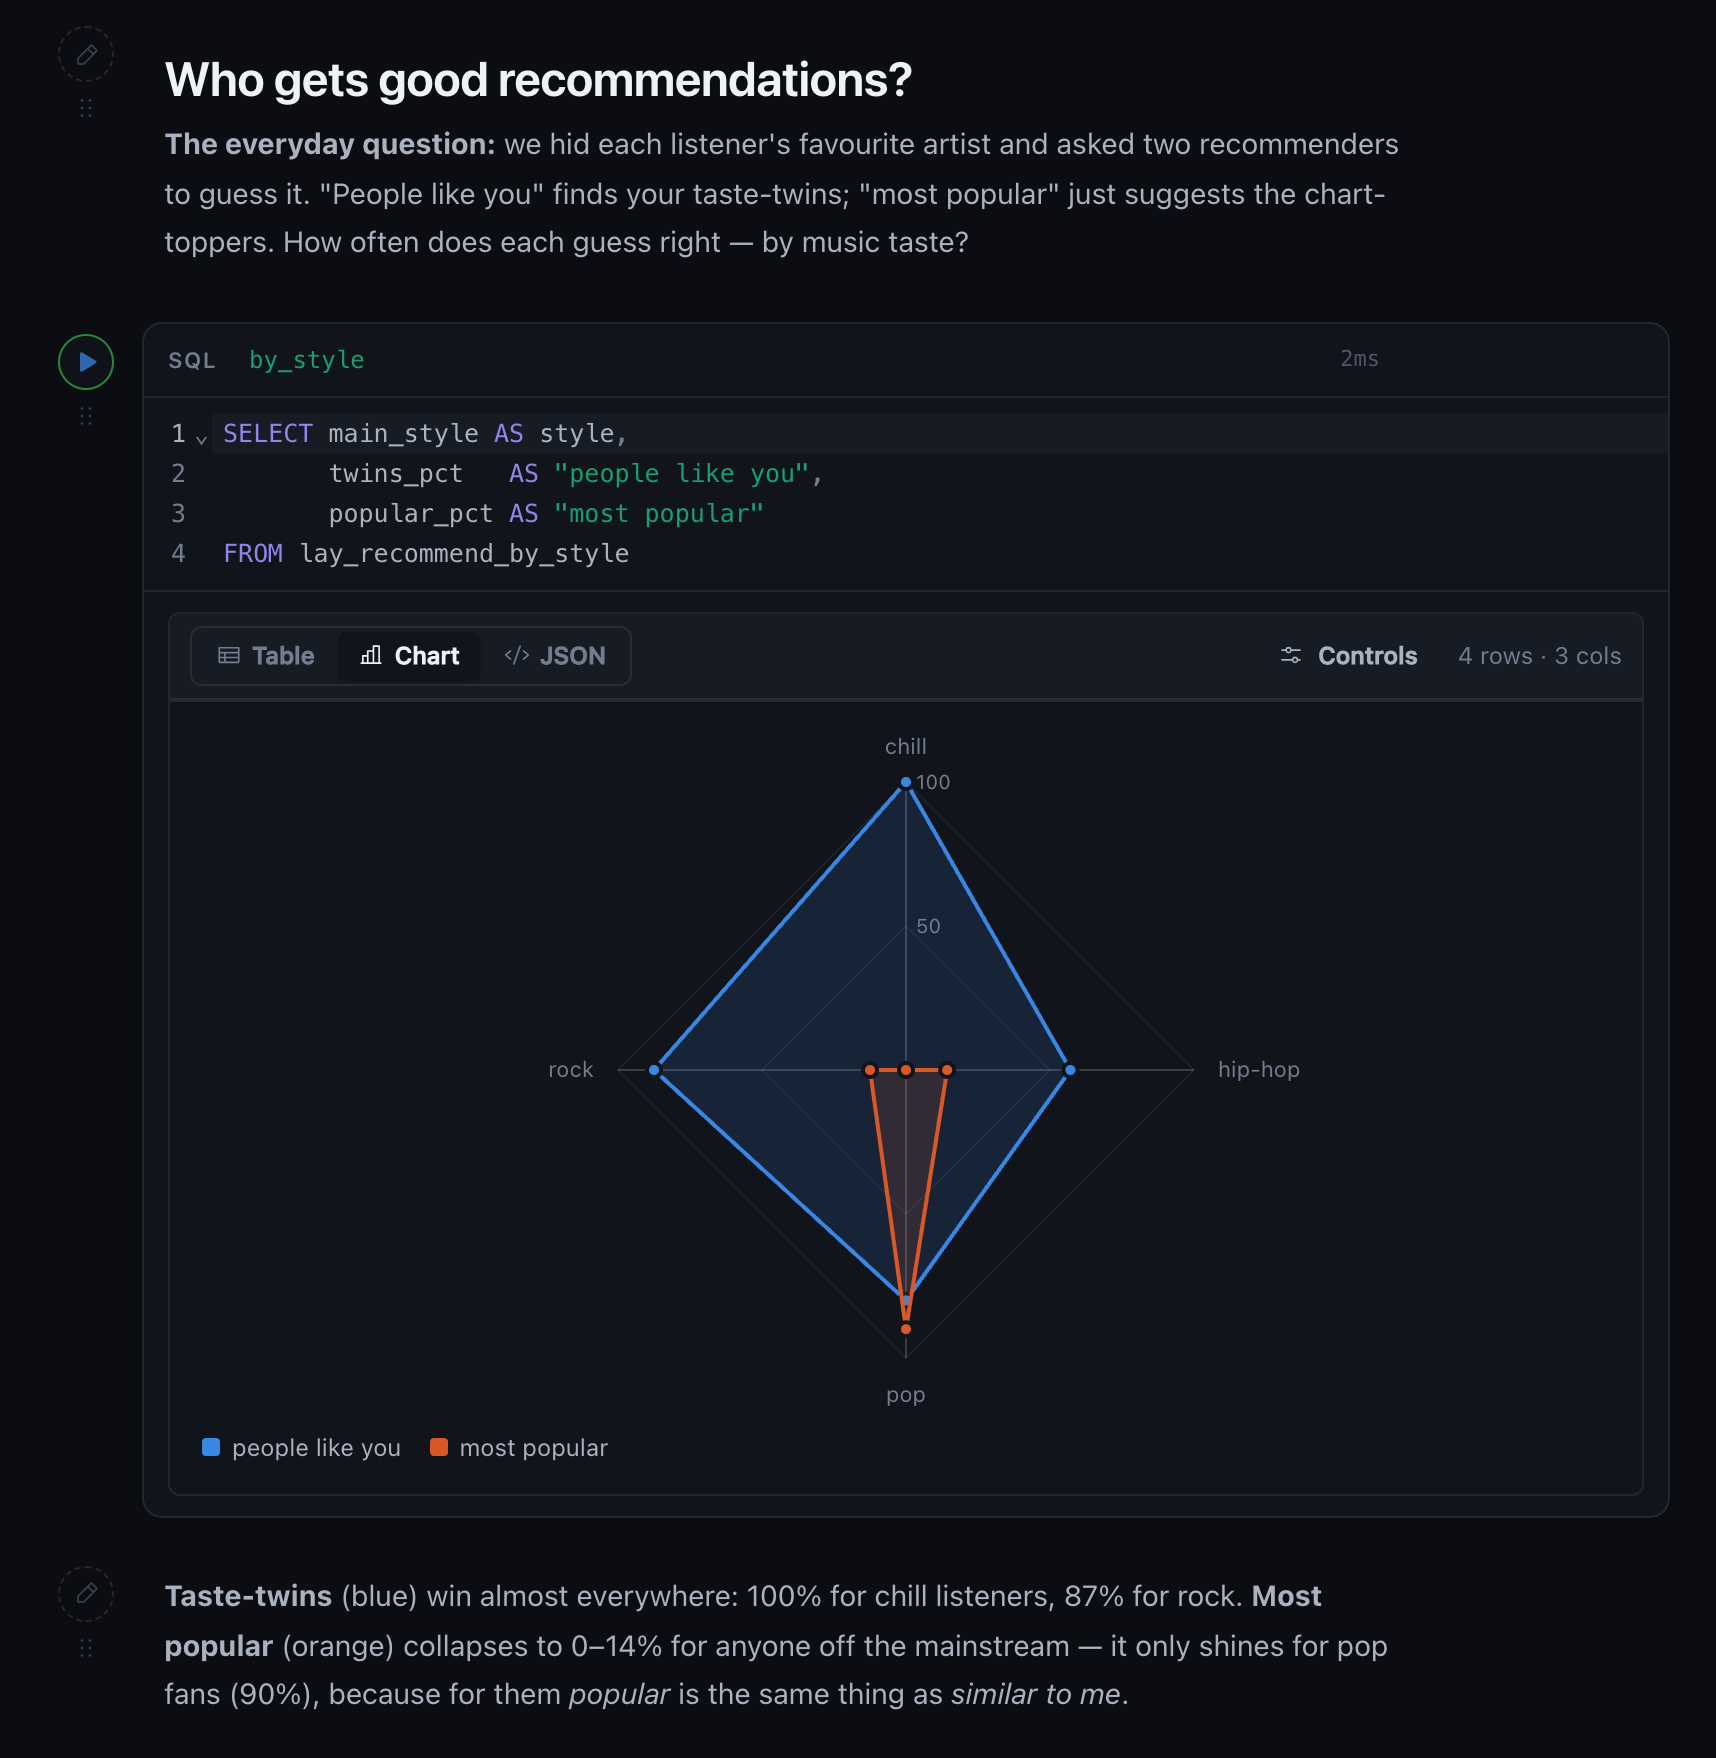
No matplotlib, no image uploads — charts are the console's own SVG renderer over the data grid behind each cell. Publish the notebook and the outputs ship with it, read-only.
Linear regression from the ground up open ↗
Normal equation vs sklearn (match to 9e-14), gradient descent with a learning rate that diverges past the stability limit, Ridge/Lasso coefficient paths.
How a classifier decides open ↗
Sigmoid, log-loss, a decision-boundary map, a 50-threshold sweep → ROC/AUC 0.9968 on breast-cancer, calibration vs a tree and k-NN.
Overfitting & bias-variance open ↗
Polynomials of degree 1–15 on a noisy sine, bias²/variance from 200 bootstraps, k-fold picking the degree, learning curves, Ridge taming degree 15.
How Shazam hears music open ↗
Naive DFT vs radix-2 FFT (548× faster at N=4096), a spectrogram, constellation hashes, and a noisy clip matched by offset voting.
PageRank on a synthetic web open ↗
Power iteration converging in 42 steps, a damping sweep, and a link farm dropping from in-degree rank 1 to PageRank rank 8.
Backprop from scratch open ↗
A 2→36→36→1 MLP written in TypeScript, the chain rule written out, decision-boundary snapshots per epoch, 90.4% held-out accuracy.
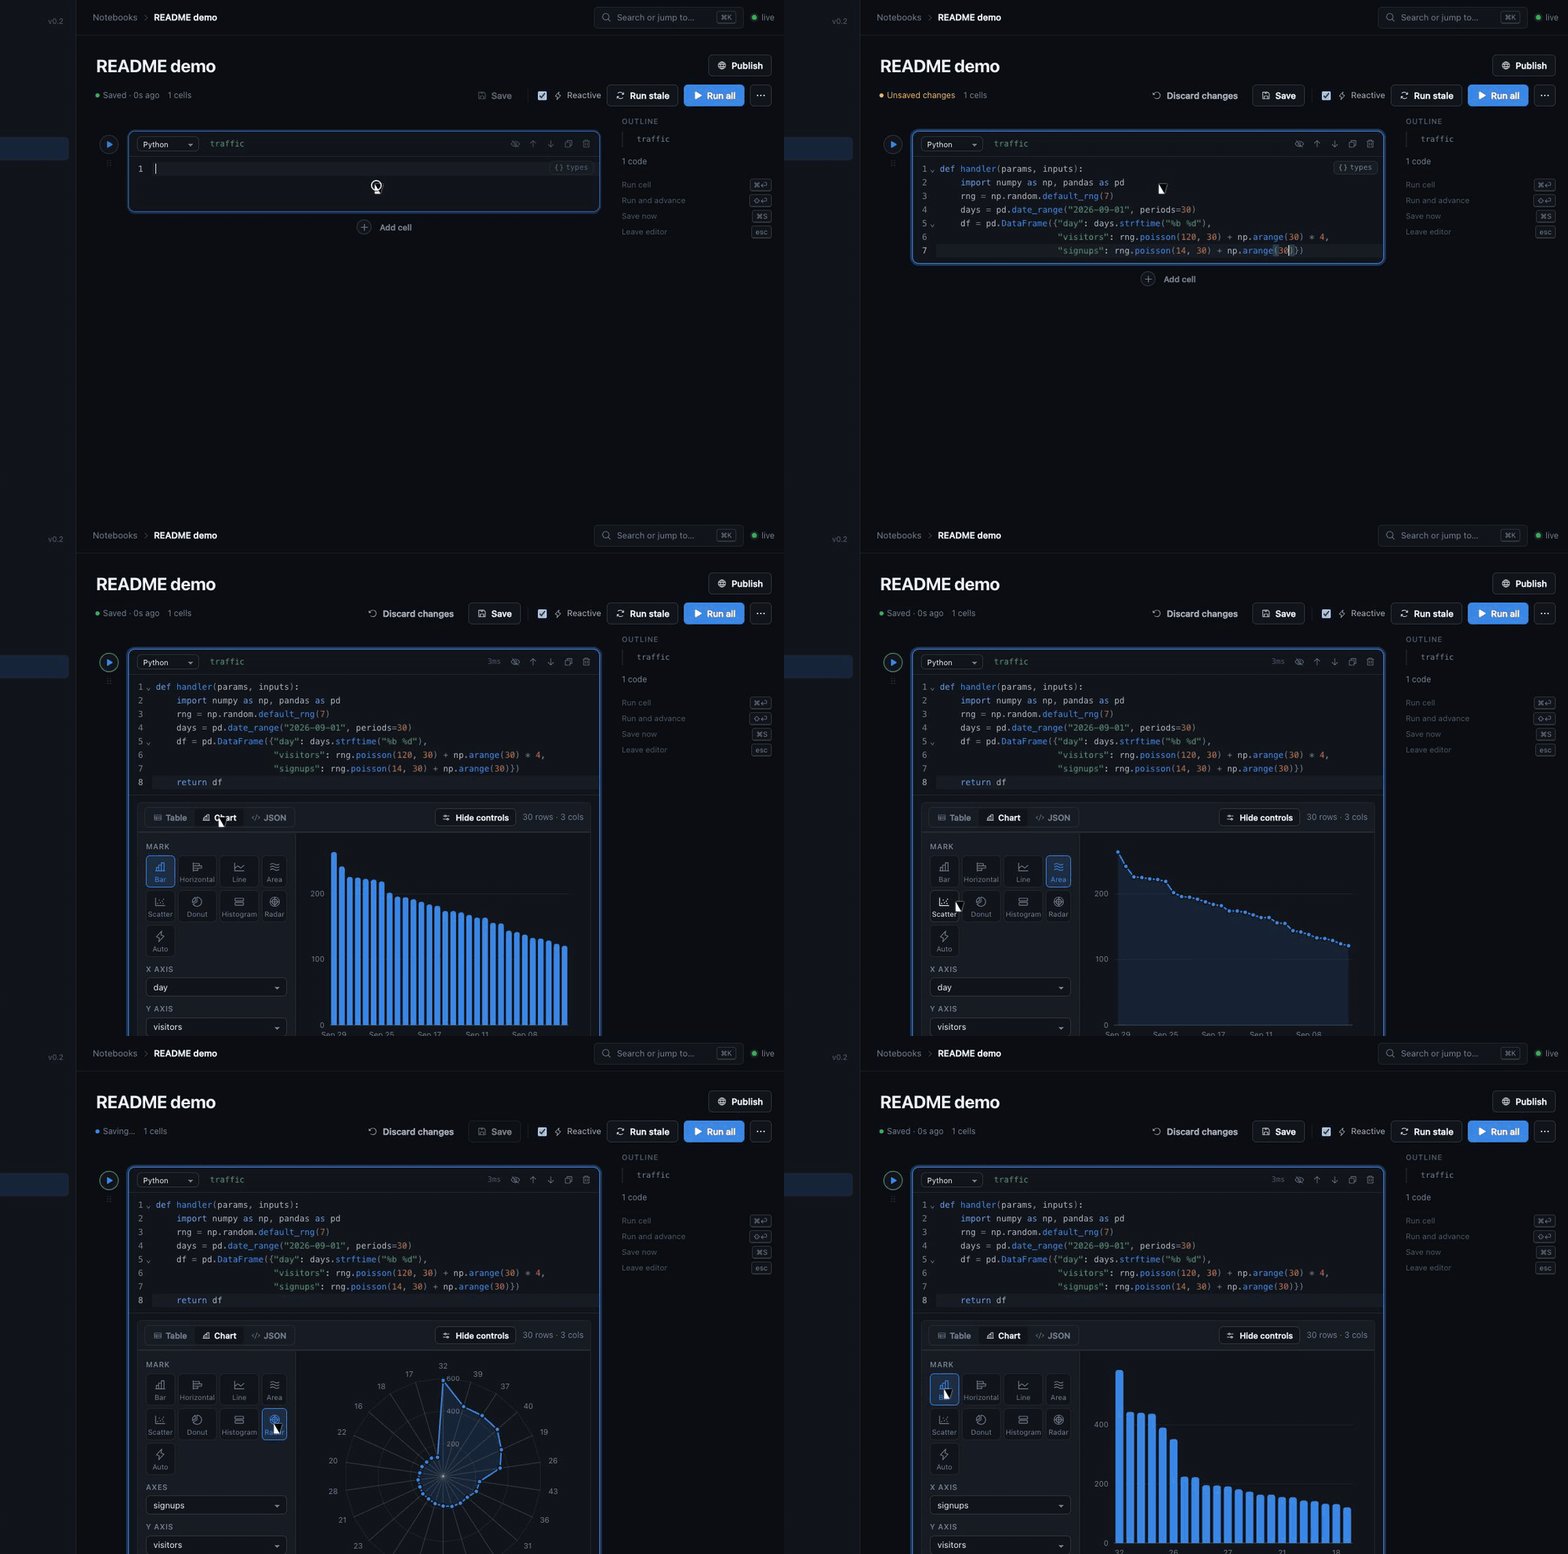
Write a cell. Run it. Pick a chart.
A Python cell returning a DataFrame becomes a data grid with column profiles; the Chart tab opens the controls — nine marks, colour by column, min/avg/max lines, per-series colours — and the spec saves with the notebook.
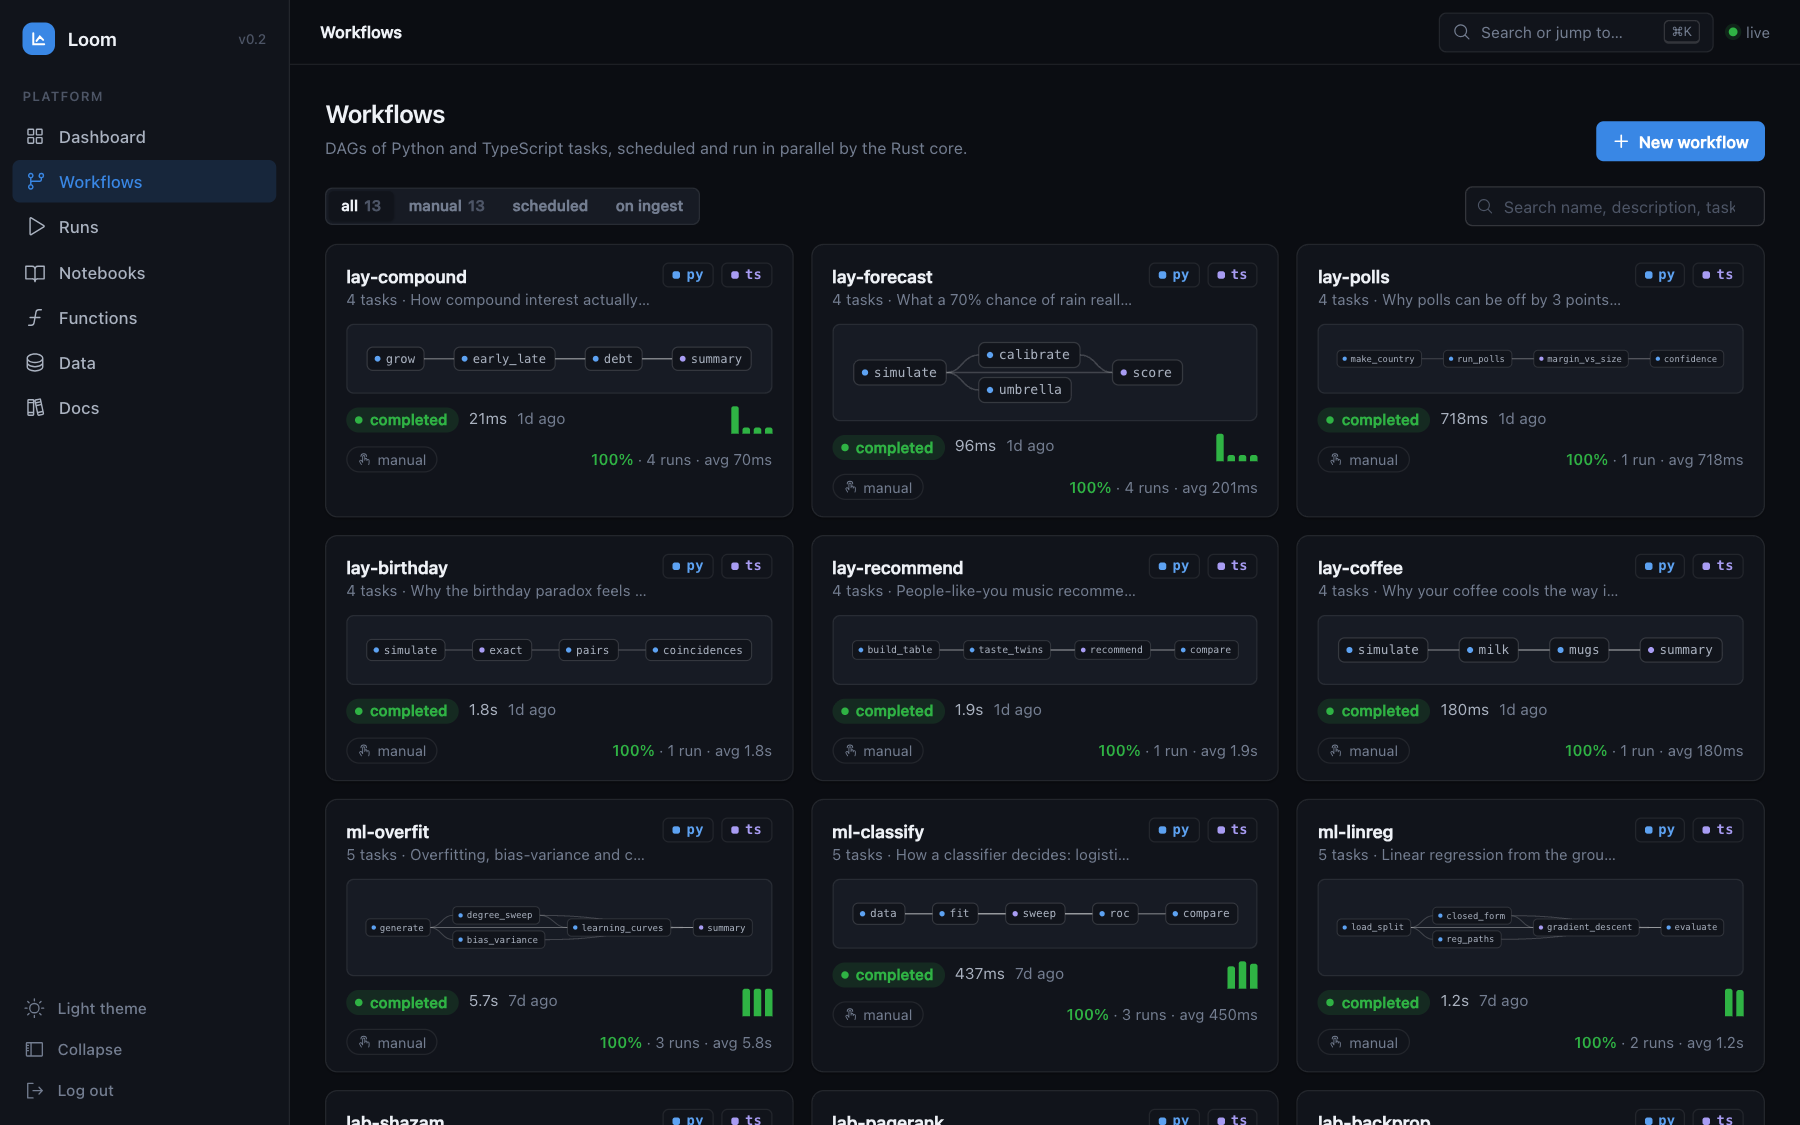
Pipelines you can actually see.
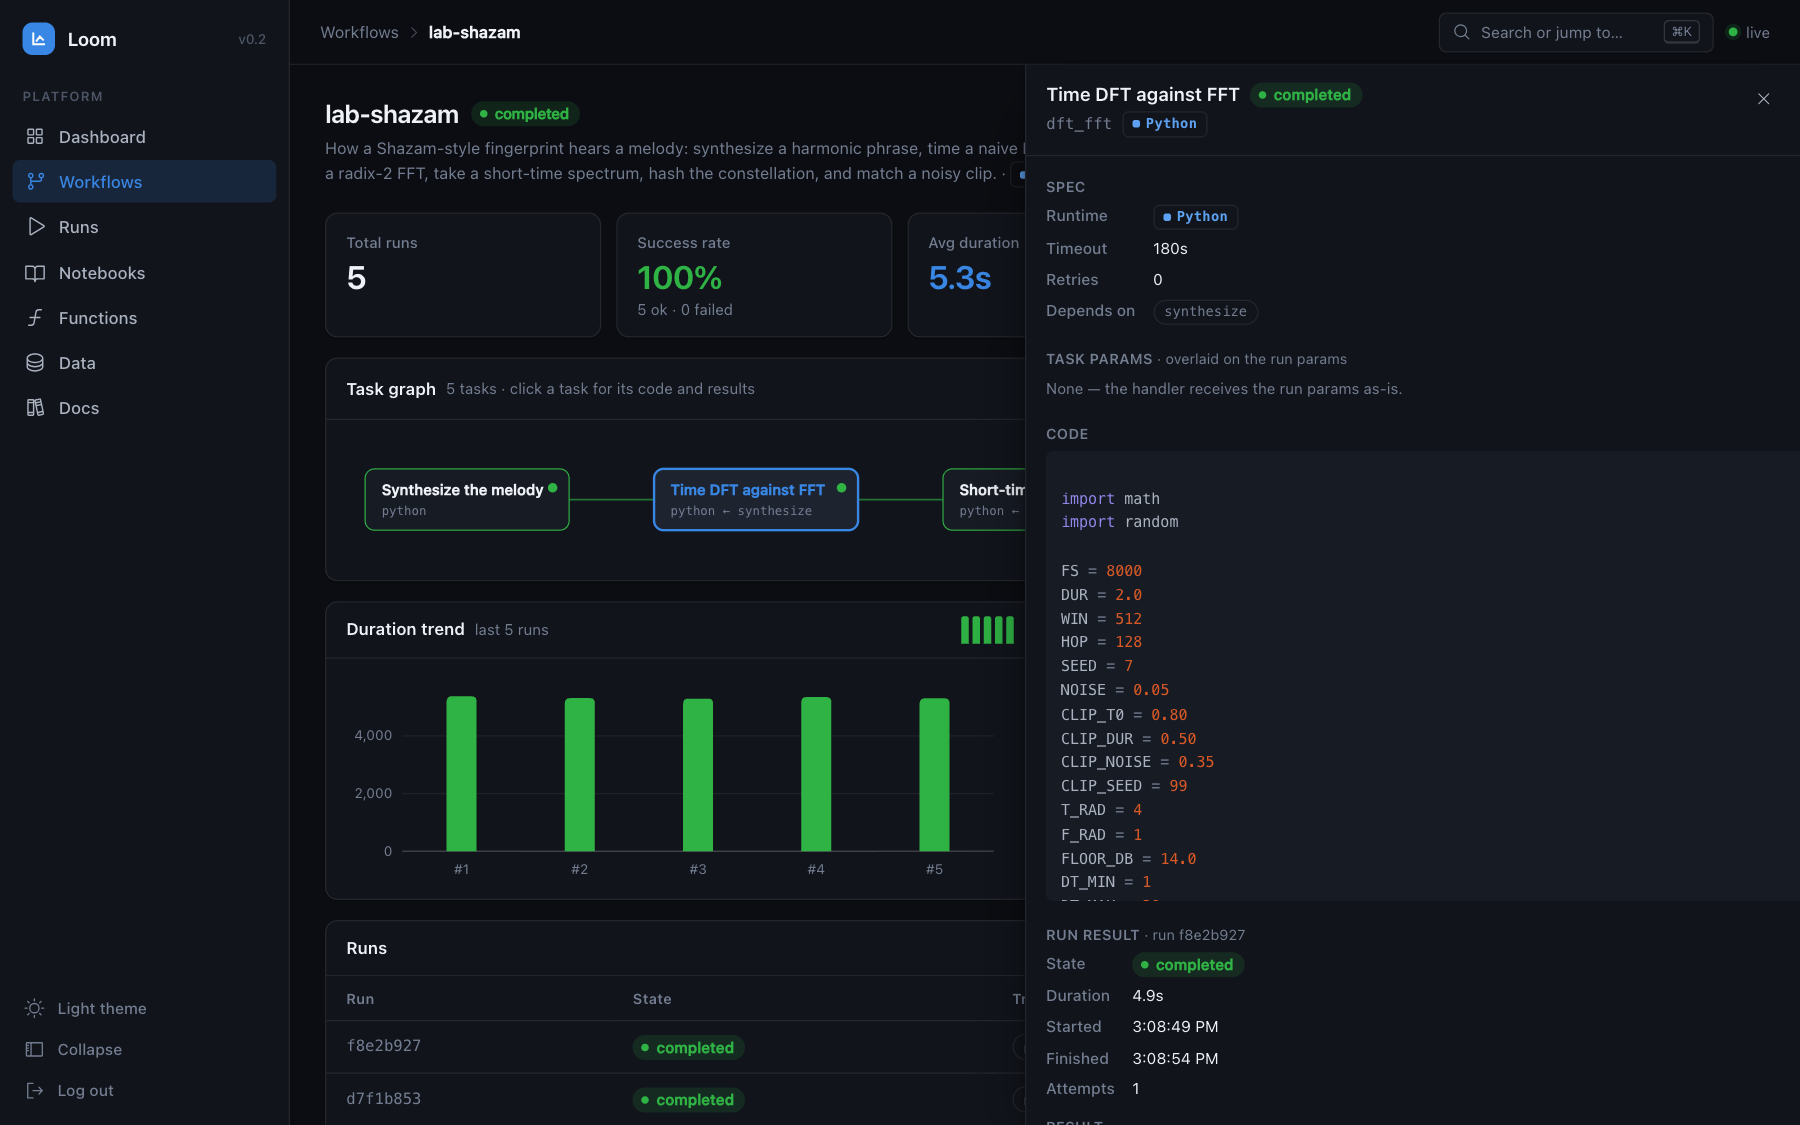
Every workflow is a card with its task graph, trigger and last run. Open one and click a task for its code, params and the selected run's result; open a run for a Gantt timeline and task rows that expand into tables, charts and logs.
Five products. One process.
The orchestrator, the serverless runtime, the analytics engine, the notebook, and the agent interface usually arrive as five vendors and a Kubernetes cluster. Loom ships them as a single binary with SQLite inside.
Polyglot DAGs
Python, TypeScript, and JavaScript tasks in one graph — a Python task's output becomes a TS task's input. Parallel layers, retries, timeouts, cycle-validated at deploy.
Warm pools or sandboxes
Interpreters stay alive between tasks — 36 ms → 1.2 ms per Python invoke. When trust matters more than latency, flip one env var to run each task in a locked-down container or a microVM (Kata / Firecracker).
Streaming everything
Run states, task logs, and metrics broadcast over SSE. Ingestion consumes NDJSON chunk-by-chunk at ~780 MB/s — gigabyte payloads never sit in memory.
SQL on a Rust engine
Every dataset is a table. Embedded Polars aggregates 1.8M rows in ~250 ms — from the API, the SDKs, notebook cells, or loom.query() inside any task. Postgres, ClickHouse & chDB connectors included.
Serverless functions
Deploy a handler in either language, invoke over HTTP with JSON or stream logs + result via SSE. ~775 invocations/s on a dev container.
Notebooks
Observable-style executable documents: markdown with images, code cells in any runtime with data-aware autocomplete (it knows the fields of the cell above), SQL cells, and nine chart marks — bar, line, area, scatter, donut, histogram, radar, min/avg/max bands — with a colour picker. Publish read-only with one click.
Agent-native (MCP)
A built-in Model Context Protocol server with 15 tools: agents compose workflows, execute code, query data, create notebooks, and read results — a self-correcting loop out of the box. claude mcp add loom … and go.
One password. Publish what you want.
Set LOOM_PASSWORD and the API, MCP, and console are locked. Hit Publish on a notebook and anyone with the link can read it — cells, outputs, charts — but nothing public can execute or edit. Unpublish any time.
Zero infrastructure
One 67 MB binary, one SQLite file (WAL), one volume. 16 MB RAM idle, 0% CPU. Deploys on a $4 VPS, docker compose, or Coolify in three clicks.
Benchmarks
Every number below was measured on a modest shared dev container — release build, real CPython 3.11 / Node 22 workers, real HTTP round-trips. Reproduce them from the repo.
Warm pool vs. cold spawn — invoke latency (p50)
Data path — one process, no warehouse
Define in your language. Run on Rust.
from loom_sdk import LoomClient, Flow, task

@task
def extract(params, inputs):
    return {"values": list(range(params["n"]))}

@task(depends_on=[extract], retries=2)
def total(params, inputs):
    return sum(inputs["extract"]["values"])

client = LoomClient("http://localhost:7420")
wf = client.deploy(Flow("sum", params={"n": 100},
                        tasks=[extract, total]))
run = client.trigger(wf["id"], wait=True)
# run["state"] == "completed" · 7 ms later
import loom   # injected into every worker

def handler(params, inputs):
    rows = loom.query("""
      SELECT zone, AVG(value) AS avg_v
      FROM telemetry GROUP BY zone
    """)  # 1.8M rows, ~250ms, in Rust
    loom.ingest("zone-aggregates", rows)
    return {"zones": len(rows)}

# agents drive the same surface over MCP (15 tools):
$ claude mcp add --transport http loom http://localhost:7420/mcp \
    --header "Authorization: Bearer $LOOM_PASSWORD"
> "Build a lab that teaches gradient descent: data,
>  three learning rates, loss curves, explain the math."
# → workflow + run + datasets + a published notebook
Your infra bill will think
it's a rounding error.
ghcr.io/danielmcsheehy/rust-orchestrator # or Coolify: New Resource → /docker-compose.coolify.yml · or git clone && docker compose up --build